
Analytics
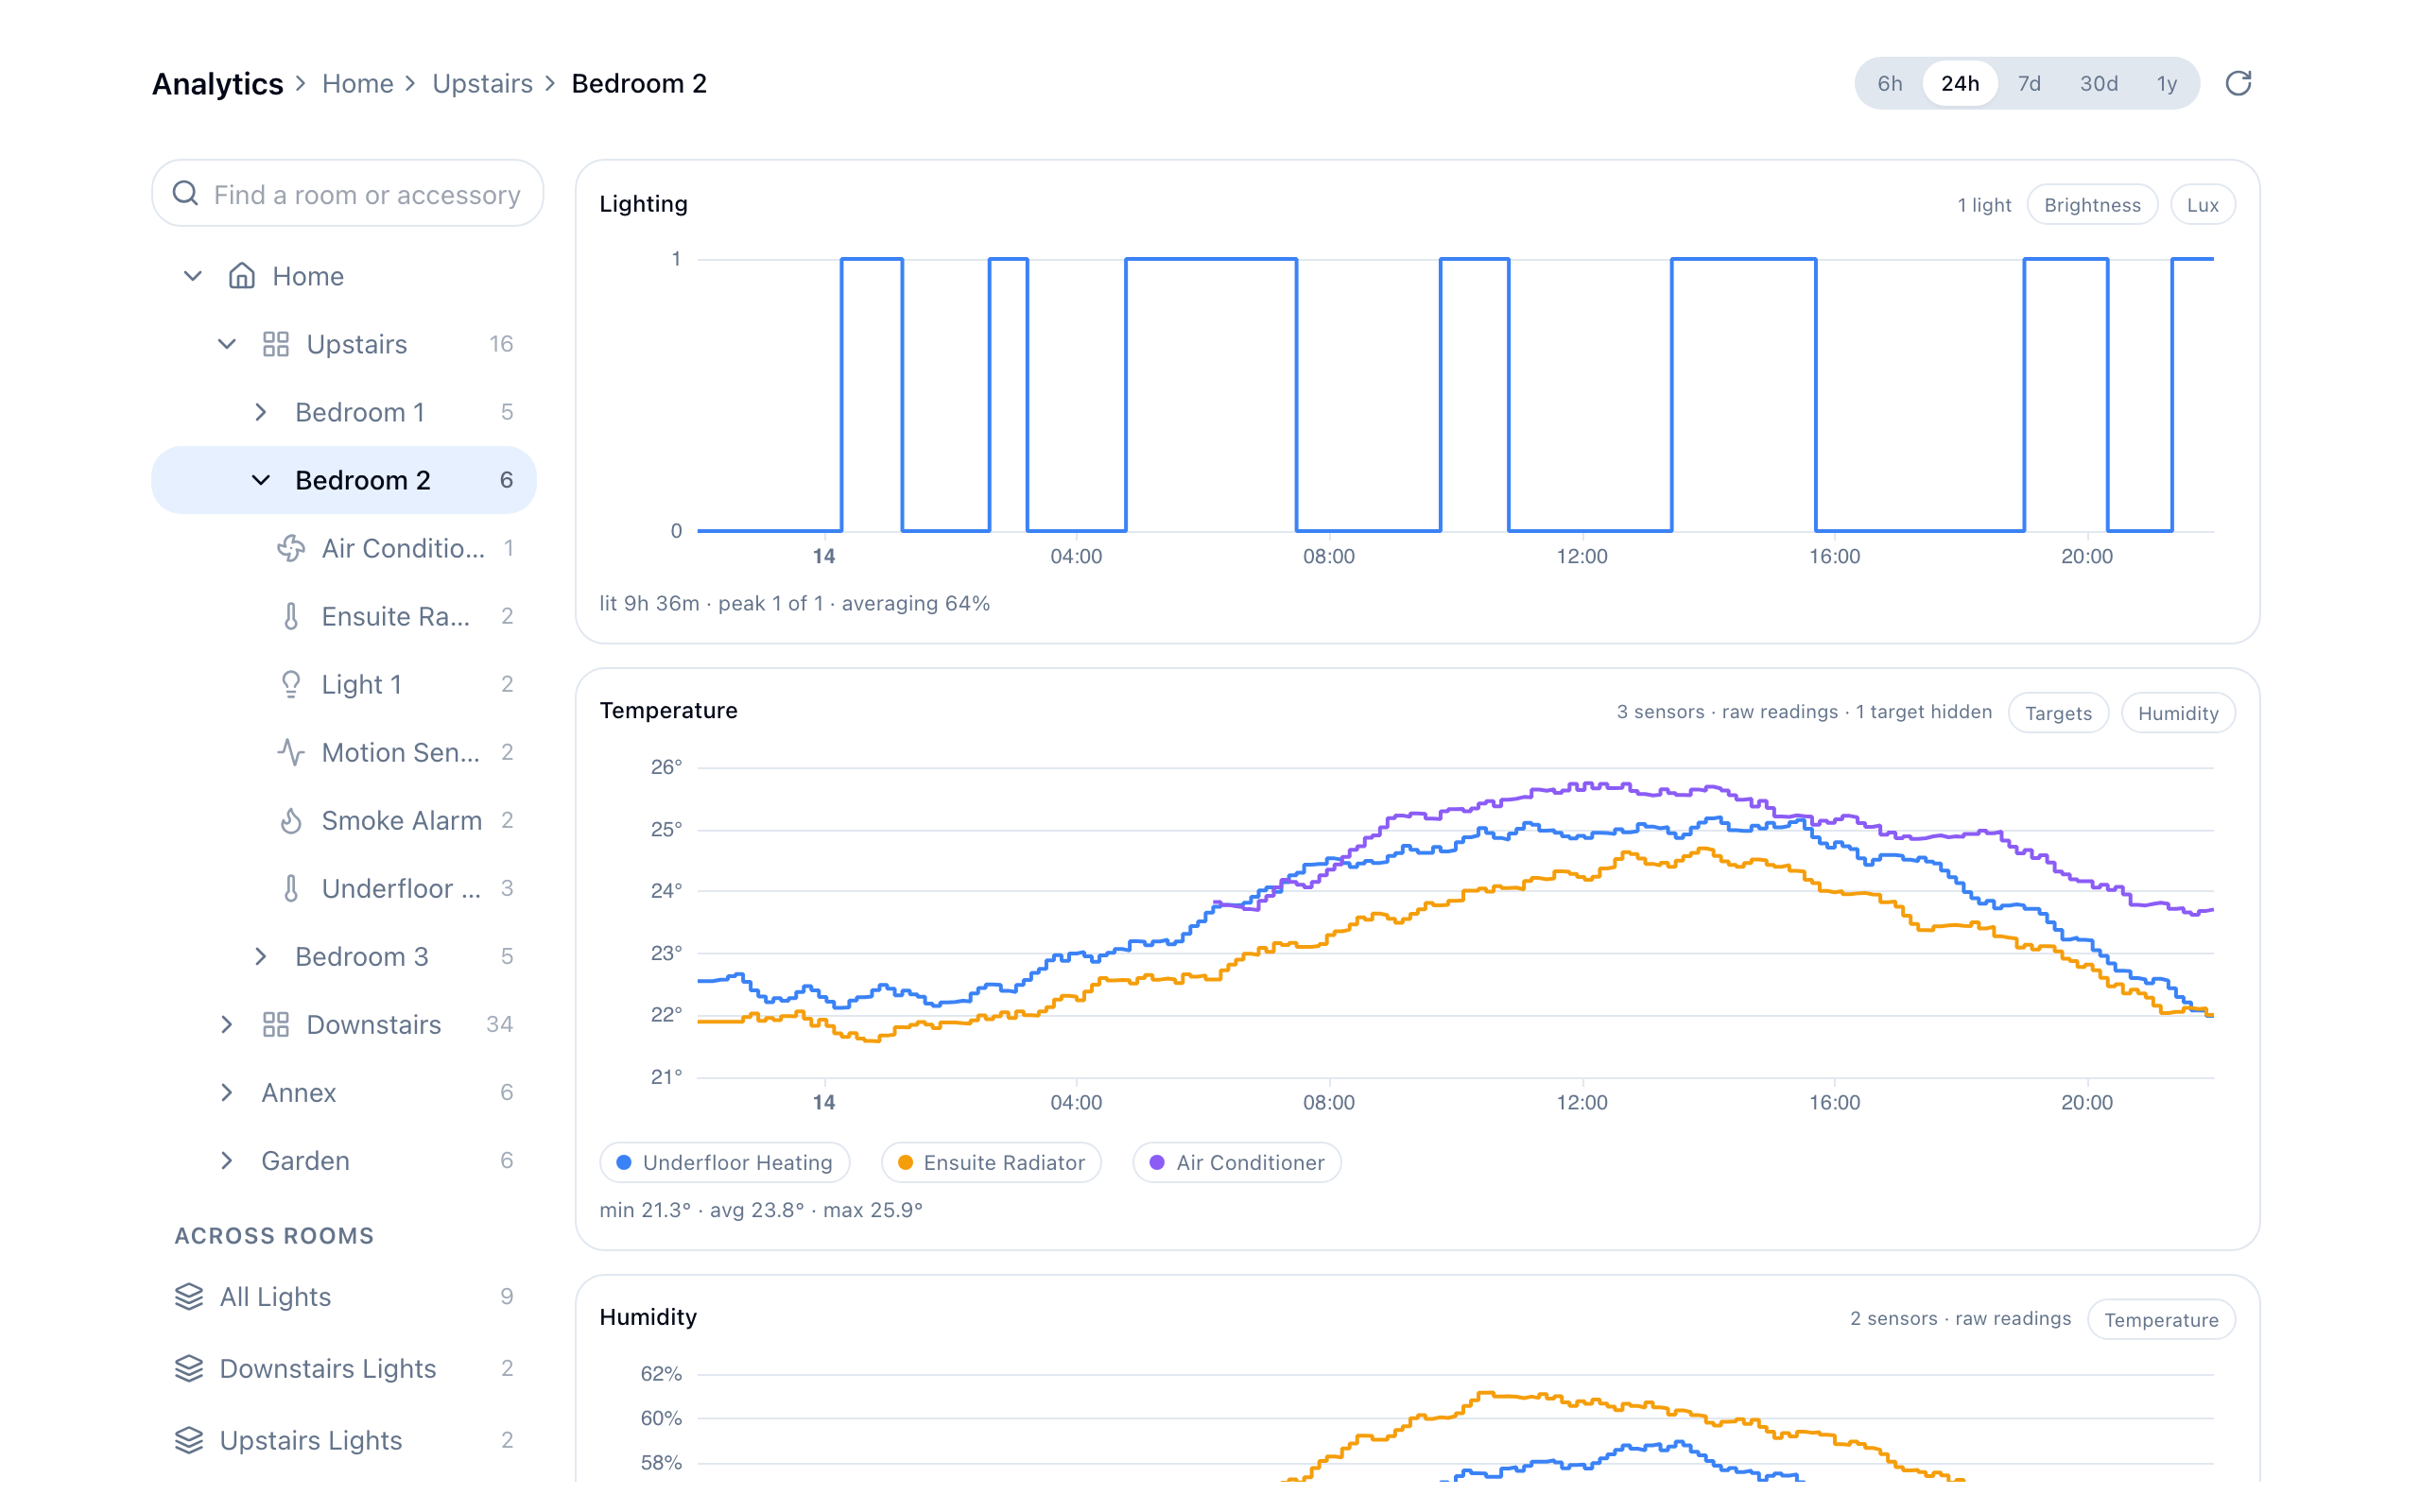
Analytics records how your accessories' characteristics change over time — temperature curves, humidity, light level, when doors opened, how long the heating ran — and turns them into insights and charts.
It is off by default. Homecast does not store accessory states, sensor readings, or activity history unless you explicitly turn Analytics on, and you choose exactly which accessories and characteristics are recorded.
Where your data lives
| Edition | Storage |
|---|---|
| Community | Only on your own Mac (in the relay's local database). It never leaves your home. |
| Cloud | In your Homecast Cloud account. You can export or delete it at any time; deleting your account deletes it too. |
Turning it on
- Open Settings → Homes and pick a home
- Turn on Analytics
That's it — recording starts with sensible defaults: sensors (temperature, humidity, light, air quality), on/off states (lights, switches, motion, contact, locks), and modes (thermostat, security) are recorded; noisy characteristics like colour hue are off until you enable them; metadata like accessory names and firmware versions is never recorded at all.
Recording is change-based: a value is stored only when it actually changes (with per-type minimum intervals and thresholds to absorb sensor jitter). A light that stays off all day costs nothing.
Seeing charts
Per accessory: right-click (or long-press) any widget → Analytics. Numeric characteristics chart as lines with a min–max envelope; on/off and mode characteristics show as state timelines with time-in-state totals. Range tabs go from 6 hours to all recorded history.
Across accessories: open Home Analytics — from the dashboard's ⋯ menu, from the Analytics entry in any accessory, group, or room context menu, or at /analytics. It opens on Highlights: computed facts about your home ("Bedroom 2 is 3° warmer than the rest", "2 batteries below 20%", "busier than usual today"), each linking to the chart that explains it, with a card per category below.
Charts follow one rule: one measure per chart, rooms first. The Climate view tabs by measure (Temperature | Humidity | Light | CO₂ — whatever your home records); across all rooms each room's sensors collapse into a single averaged line behind a home-wide band, and picking a room shows its individual sensors. A provenance line always says what you're looking at ("9 rooms · averaged from 30 sensors").
- Climate — room-average lines per measure, drill into a room for its sensors.
- Activity — motion, doors, and locks as timeline strips grouped by room.
- Energy & Usage — power charts plus a ranked Usage today table (top accessories by time on; a row expands into its timeline).
- Battery — every battery ranked worst-first with live levels; tap one for its history curve.
- Safety — a live status board (all clear ✓, or which sensor triggered), gas-level charts when recorded. Quiet sensors show as monitoring — a good sign, not missing data.
- Groups read like one accessory with aggregated data — member temperatures as an average with spread, on/off as "how many are on" over time. The group widget's menu opens the same compact popup an accessory gets. Virtual accessories record too — numbers and counters as lines, modes and timers as named-state timelines ("Home", "Movie Night", "active").
Every view can still be customized into a free-form chart: add or remove any series (including ones with no data yet), normalize different units onto one 0–100% scale, overlay the same period a day or a week earlier, and zoom with the brush. Category views are shareable links.
Controlling what's recorded
One toggle per home: Analytics is on or off for the whole home — the sensible defaults decide what is worth keeping (see above). Individual characteristics can still be excluded through the API (setHistorySeriesConfig in GraphQL) if you need finer control; a disabled characteristic stops recording immediately and existing samples stay until you delete them.
Retention: everything is kept indefinitely — every recorded sample, plus hourly and daily summaries (minimum, average, maximum, time-in-state) that make long-range charts fast. Nothing is ever pruned automatically; only your own Delete button (or deleting your account) removes history.
Export & delete: the same home page has an Export CSV button (every raw sample, timestamped) and a Delete data button that removes everything recorded for the home. Both work in either edition.
For developers and AI assistants
History is part of every Homecast API surface:
- MCP —
query_historygives an AI assistant bulk, flexible access to everything recorded: any subset of accessories and characteristics, any date range, at raw/hourly/daily resolution, many series per call — the raw material for analysing patterns and behaviour ("what are the patterns in my home?", "when is the house usually active?").get_historyis the quick single-accessory version: "what was the temperature in the bedroom last night?". - REST —
GET /rest/history?accessory=<name>&hours=24returns the same compact series. - GraphQL —
history,historySeries, andhistoryStorageStatsqueries serve downsampled series for charting, plus mutations for configuration and deletion.
All three respect the opt-in: if History is off, they return nothing and say why.
Privacy
- Recording is opt-in per home and off by default.
- Only characteristics with a recording profile are ever stored — accessory names, models, serial numbers, and firmware versions are excluded by construction.
- In the Community Edition nothing leaves your Mac. In Cloud, history is tied to your account and covered by the Privacy Policy.
- Export and full deletion are always available, and account deletion removes all recorded history.